

Recent research shows that only a fraction of companies have successfully implemented Diversity and Inclusion (D&I) initiatives. According to a study by Harvard Business Review, only 60% of companies have D&I programs in place and reported that the strategies implemented are not always focused on the right goals.
The question is, why do so many D&I initiatives fall short, and how can organizations improve their success rate?
The answer lies in measuring and tracking the outcomes of D&I initiatives. By utilizing Key Performance Indicators (KPIs), organizations can monitor progress, identify areas for improvement, and ensure that their D&I efforts have a meaningful impact.
In this article, we'll explore how companies can use KPIs to measure the success of their D&I initiatives.
What’s in Diversity?
Diversity is about recognizing and appreciating the differences that make each of us unique. When it comes to an organization, diversity can include things like race, gender, age, sexual orientation, religion, and more.
Studies have shown that "Diverse teams tend to be more innovative and better at problem-solving. When you have people from different backgrounds and perspectives working together, you get a wider range of ideas and approaches, which can lead to better outcomes."
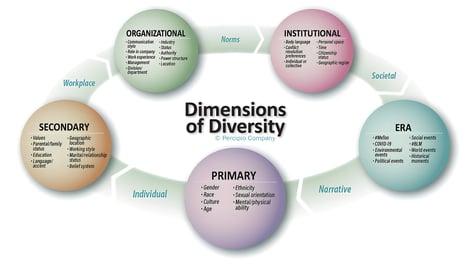
Source: Percipio Company
For example, let's say you're trying to design a new product. If everyone on your team has the same background and experiences, you might all approach the problem similarly. But with a diverse workforce, you're more likely to get a broader range of ideas and solutions, which can lead to a more successful product.
What's in 'Inclusion'?
Source: RVA.org.uk
Inclusion means everyone is treated fairly and feels like they belong. In the workplace, inclusion means that everyone has the opportunity to contribute and feel valued. It's important because it allows people to bring their full selves to work, and when people feel included, they are more likely to be productive, engaged, and loyal.
Unfortunately, there are still many people who don't feel included at work. According to a survey, only 40% of employees feel that their organization is inclusive. This is a problem because it means that people may not be able to perform at their best and may even leave their jobs.
For example, a company might create an employee resource group for LGBTQ+ employees, or hold a company-wide event to celebrate cultural holidays. These small acts can go a long way in making people feel included and valued.
The Interconnectivity of Diversity & Inclusion
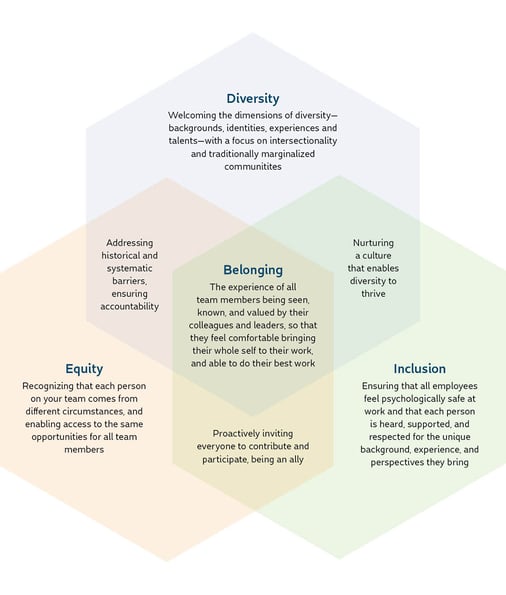
Source: Blue Beyond Consulting
Without Diversity, there would be no need for Inclusion. If we were all the same, there would be no need to ensure everyone is included. However, in today's world, Diversity is a reality, and we must ensure that we create a culture of Inclusion to allow everyone to thrive.
At the same time, without Inclusion, Diversity is not enough. Simply having a diverse group of people does not automatically lead to better outcomes or improved performance. Inclusion is necessary to leverage Diversity to make sure that everyone can contribute their unique perspectives and experiences to the workplace.
Studies have shown that companies with diverse and inclusive teams outperform those without diverse teams. Diverse companies are 35% more likely to outperform their peers. Similarly, inclusive teams are 80% more likely to achieve business goals.
Why measure KPIs for Diversity and Inclusion?
KPIs are simply quantifiable metrics that organizations use to track their progress toward specific goals. They help organizations to measure the effectiveness of their efforts, identify trends and patterns, and make data-driven decisions. In the context of KPIs for diversity and inclusion, it can be used to measure the progress of initiatives aimed at creating a more inclusive and diverse workplace.
Think of KPIs as a compass for your diversity and inclusion journey. They can reveal the direction in which your organization is headed and help you to make course corrections when necessary. For example, KPIs can provide insights into the representation of underrepresented groups in your workforce, the number of diversity and inclusion training programs offered, and the level of employee engagement.
But KPIs aren't just a measure of the past. They can also be used to set goals and guide future action. By setting targets and establishing a baseline for measuring progress, organizations can use KPIs to drive real change. For example, an organization may set a goal to increase the representation of underrepresented groups in their workforce and track their progress toward that goal over time.
Diversity and inclusion initiatives can be tricky, as inclusion is often invisible, making it difficult to know whether your team feels included and welcome in the workplace. But by utilizing KPIs, businesses can go beyond check-the-box activities and objectively assess where they're falling short. They are able to evaluate their performance, pinpoint their areas for development, and take the required steps to effect genuine change.

How to measure and track Diversity and Inclusion goals
Source: DSM
The concept of Diversity, Equity, and Inclusion (DEI) has become an increasingly crucial aspect of organizational strategy. One of the most effective ways to measure progress in these areas is by using Key Performance Indicators (KPIs). To measure DEI effectively, organizations must adopt a data-driven approach that considers various metrics.
To accurately measure progress, it is essential to identify clear objectives and Diversity & Inclusion goals, as well as to establish a baseline from which progress can be measured.
Once these Diversity & Inclusion goals and objectives have been established, organizations can move on to selecting the right KPIs. The right KPIs will depend on the specific goals and objectives of the organization, but some Diversity & Inclusion KPI examples include gender pay gaps, representation of underrepresented groups, and employee satisfaction with the DEI initiatives. It is important to choose the right KPIs because they serve as a barometer of progress and provide valuable insight into the effectiveness of DEI initiatives.
Data-driven diversity and inclusion goals can also be achieved by leveraging diversity and inclusion data baselines. This involves creating scorecards that are integrated into existing governance processes and leadership cadence, with the goal of making diversity and inclusion metrics more accessible and actionable for organizations.
Using KPIs in conjunction with employee engagement surveys can provide a framework for measuring progress and success in D&I initiatives. For example, KPIs can be used to track the percentage of employees who report feeling included in the workplace or the number of employees who participate in D&I training programs. By tracking and analyzing these KPIs over time, organizations can identify trends and determine the effectiveness of their D&I initiatives.
Finally, it is important to be willing to ask the right questions and be transparent about DEI progress. This requires clear communication about who has responsibility for DEI KPIs and how progress will be tracked, as well as accountability and action to drive real change.
Diversity and Inclusion KPI examples to gauge
Representation
The representation metric is a key diversity and inclusion (D&I) indicator that measures the percentage of underrepresented groups within an organization. It's an essential metric for companies that want to track and improve their D&I efforts. The representation metric is calculated by dividing the number of employees in each underrepresented group by the total number of employees in the organization.
For example, if a company has 100 employees, and 30 of them are women, the representation of women would be 30%. Similarly, if the company has 10 employees from a minority group, the representation of minorities would be 10%.
The representation metric can be further broken down into different categories such as gender, race, ethnicity, age, disability, and sexual orientation. By analyzing these categories, companies can identify which areas of their workforce are underrepresented and take action to improve representation.
Retention
It measures the number of employees who stay with the organization over time and is a key metric for gauging the success of DEIB initiatives. Retention data can be collected through employee turnover reports, annual surveys, or exit interviews. By tracking the retention of diverse employees, companies can understand the level of job satisfaction, opportunities for career growth, and the overall level of inclusiveness within the organization.
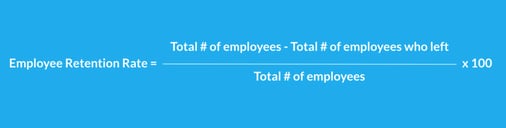
Source: AIHR
To calculate retention metrics, a company needs to track the percentage of diverse employees who leave the organization over a given period. This includes employees from underrepresented groups such as women, racial and ethnic minorities, LGBTQ+ individuals, and people with disabilities. The data can be further analyzed by department or job level to identify areas where retention rates may be lower for diverse employees.
For example, if a company had 100 diverse employees at the start of the year and 90 of them remained at the end of the year, the retention rate would be 90%.
Recruitment
Measuring the representation of underrepresented groups in the recruitment process can provide valuable insights into the diversity of the applicant pool and the potential barriers to diversity in the hiring process. But how to measure and track the recruitment process?
Source: AIHR
Recruitment can be evaluated by tracking the representation of diverse candidates in the pool of applicants for open positions. For instance, if a company received 100 job applications and 25 of them were from diverse candidates, the diverse candidate representation in the applicant pool would be 25%.
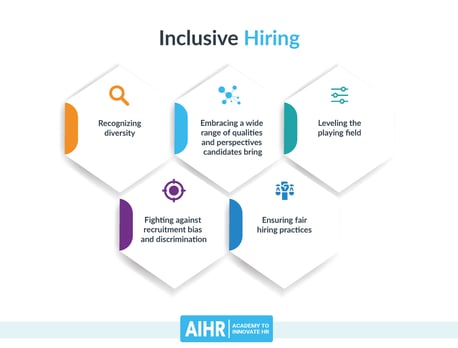
In today's diverse world, recruitment strategies that focus on building a diverse candidate pool are essential. One such strategy is blind hiring, which involves removing identifying information from resumes to reduce unconscious biases.
Promotion
It ensures that diverse employees are provided with equal opportunities for career growth and advancement within the company. The promotion metric measures the progress made in promoting a diverse workforce to higher positions within the company.
Promotion can be measured by tracking the representation of diverse employees in leadership positions. For instance, if a company has 50 employees in leadership positions and 10 of them are diverse, the representation of diverse employees in leadership would be 20%.
For example, a study by McKinsey & Company found that companies in the top quartile for ethnic and cultural diversity were 35% more likely to have above-average profitability. This metric helps companies track their progress in promoting a diverse workforce and identify any areas that need improvement.
Employee Development
This metric measures the extent to which employees from underrepresented groups are given access to professional development and career advancement opportunities.
One way to measure employee development is by tracking the number of programs conducted and the participation rate of employees from diverse backgrounds. For example, if an organization conducts 10 employee development programs in a year and 50% of employees from diverse backgrounds participate, the KPI would be 5.
The study reported that companies with effective training and development programs had a 218% higher income per employee than companies with ineffective training programs.
Pay and benefits
It focuses on ensuring that everyone in the organization receives fair compensation for their work and that all employees have access to the same benefits.
The gender pay gap is calculated by dividing the average earnings of women in the organization by the average earnings of men and multiplying the result by 100. For instance, if the average earnings of women in an organization are $50,000 and the average earnings of men are $60,000, the gender pay gap would be 83.3% (50,000/60,000 * 100).
Another factor to consider when measuring this metric is the availability of benefits such as health insurance, retirement plans, and paid time off. The goal is to ensure that all employees, regardless of their background, have access to the same benefits.
Employee engagement
Employee engagement is a metric that measures the emotional and psychological attachment employees have towards their work and organization.
It can be measured through employee satisfaction surveys. For example, if an organization conducts 100 employee satisfaction surveys and 70% of employees from diverse backgrounds rate the DEIB initiatives as satisfactory, the KPI would be 7.
A survey by The Engagement Institute found that disengaged employees cost organizations between $450 and $550 billion per year. This highlights the importance of monitoring and improving employee engagement levels.
Exit interviews
The data gathered from these interviews can help organizations understand the reasons behind employee departures and identify areas where they can improve. For example, if a high percentage of employees from underrepresented groups are leaving the company, it may indicate a lack of inclusivity in the workplace. This can be calculated by dividing the number of departures from diverse groups by the total number of departures in a given time period.
However, Gallup found that those who received the feedback saw a 14.9% lower turnover compared to those who didn’t receive any feedback. This highlights the importance of not only conducting exit interviews but also taking action on the feedback provided.
This information can be used to make changes to company policies or processes, improve employee satisfaction and retention, and ultimately create a more positive work environment.
Using EngageRocket to measure Diversity and Inclusion KPIs in 2023 and beyond
EngageRocket, an innovative platform, offers a simple and straightforward way to track your progress on the Diversity & Inclusion goals, ensuring that your efforts are always on the right track.
Struggling to keep tabs on employee satisfaction levels? EngageRocket makes it a breeze with its easy to use employee survey platform. Simply send out a pulse survey to gauge how your employees feel about the inclusivity of your workplace, and you'll have the data you need to make informed decisions.
For instance, do you want to compare the employee experience between minority vs majority group or between gender groups? With EngageRocket, you can easily track this critical KPI by comparing the employee experience of men and women in your company. And with the ability to drill down into the data, you can identify where the disparities are coming from and take action to close the gap.
Want to know how many of your managers are being rated as inclusive by their teams? EngageRocket has got you covered. Its real-time analytics allow you to track this KPI and see how your managers are faring in terms of fostering a diverse and inclusive work environment.
With EngageRocket, you'll be well on your way to building a more inclusive and equitable workplace for all!
Want more content like this?
Join EngageRocket's HR Impact community and get the latest HR resources and exclusive event invites!

 .
. 