

Our Lead People Scientist explains how organizations can use predictive analysis to get actionable insights to improve employee experience.
What is predictive analytics?
Predictive analytics has been gaining a lot of attention in Human Resources (HR) and will be one of the biggest enablers for HR to strategize more effectively to achieve important human capital outcomes such as greater learning and development and lower turnover.
To develop the People Analytics capability, organizations and HR cannot shy away from data and statistics. Most organizations should have already been collecting data such as employee headcount, employee compensation, training courses attended, number of leave days taken, etc. which is a good start and a good basis for higher-level analytics. What we need to do is elevate such analytics from a descriptive level to a predictive level, which is 3 steps further - from focusing on what happened in the past to predicting what will happen in the future. As an example, instead of finding out if your organization is also experiencing the Great Resignation of 2021, it may be more prudent to find out who or when will leave the organization next, so that the organization can work to retain them.
Using predictive analytics for problem-solving
Let us take a step back and see how predictive analytics can be useful for problem-solving using an everyday example.
Assume that you want to cut down on your caffeine intake. The first step (Descriptive Analytics) to solve this problem with a data-driven approach is to find out how much caffeine you drink everyday. You may then wonder if there are specific factors that affect your caffeine intake, so you look into some of your habits and collect data in those areas (Explanatory Analytics). Then perhaps you may have a hypothesis that the amount of sleep you had the previous day could be a factor, but you are not sure how or why, so you try to examine if there is a trend, such as how much less caffeine you consume for every hour of sleep you get more (Exploratory Analytics). From there, you can tell how much sleep you need to get on a particular day to cap your caffeine intake at one cup the next day (Predictive Analytics).
Solving a problem at work does get more challenging as there is a need to think about collecting data from all employees and how to make it more efficient. From simple forms to spreadsheets to survey analytics platform like EngageRocket, there are many digital tools that you can leverage on.
Let’s look at how predictive analytics can help a work-related problem. The reality about real-world problems is that they are usually complex and many different factors can come into play. Just like how we wouldn’t expect only one work aspect to affect job performance, the same goes for other important work outcomes such as employee engagement.
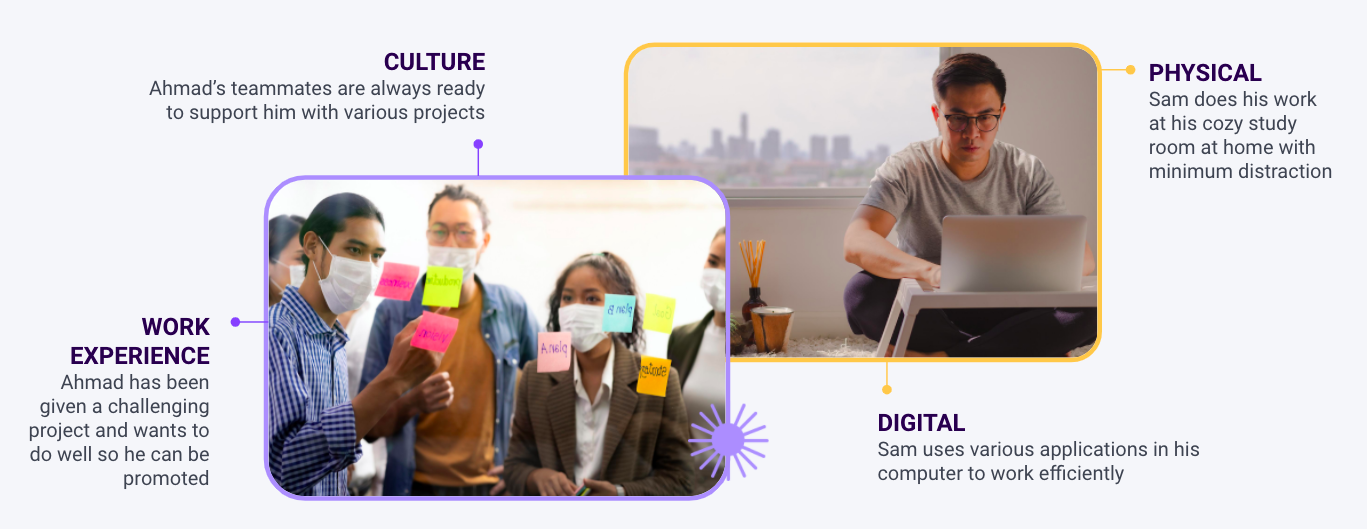
From the physical environment that employees work in to culture that employees are influenced by, and from the actual nature of work to the tools they use to complete the work, it is critical to examine which of these factors of employee experience will impact engagement the most. From there, organizations can then work on the factors that have the greatest return on investment.
Looking for a comprehensive playbook on employee experience? Check out our ultimate Employee Experience Guide here.
Analytics tool spotlight: Regression analysis
Regression analysis as a people analytics tool can help with more complex problems such as employee engagement. Regression is a supervised machine learning technique that examines the relationship between one or more factors (i.e., predictor variables) and an outcome. The statistical analysis takes into account that these predictor variables may be related to each other as well. For example, whether an organization has an open culture of communication (predictor 1) can affect whether employees are clear about what is expected of them (predictor 2). So if we do find that communication (predictor 1) and clear expectations (predictor 2) are related to employee engagement (outcome), we need to be able to distinguish between whether communication has a unique relationship with employee engagement (scenario 1) or whether the relationship between communication and employee engagement is actually overlapping with the relationship between clear expectations and employee engagement (scenario 2). This is achieved by examining the relationship between each predictor variable and outcome variable while holding the other predictor variables constant as a fixed value during the statistical analysis.
There are many sub-types of regression, and the choice of regression type should be based on the nature of the outcome variable. For example, we would analyze the data differently if engagement is measured as Engaged/Disengaged (2 categories) or on a 9-point numeric scale. Logistic regression would be used in the former scenario while Linear Regression would be used in the latter case.
Let us use the example of linear regression to dive deeper. If we want to examine the relationship between only one predictor variable and one outcome variable, we can plot all the data points on a horizontal axis representing the predictor variable and the vertical axis representing the predictor variable. Thereafter we try to draw a linear line that best fits the data, such that the distance between each data point and the linear line is the smallest possible.
This line can be represented by a mathematical equation, which looks like this:
Y = Intercept + Slope1XPredictor1
Where Y is the outcome, X is the predictor, intercept is the value at which the line cuts the vertical axis, and Slope is the gradient of the line (i.e., how much Y would change per unit change in X).
Based on the slope and how statistically significant the slope is, you can tell if there is a relationship between the predictor and the outcome. Statistical significance is a measure of how likely the results you have found is due to chance, which depends on a few factors such as the number of data points used in the analysis and the amount of noise in the data.
As you might have realized, the analysis would become much more complicated when we add more predictor variables into the equation as (a) the equation would have a new slope for each predictor and (b) the plots would no longer be 2-dimensional as a new dimension would be required whenever a new variable is added.
Y = Intercept + Slope1XPredictor1 + Slope2XPredictor2
When conducting such multiple linear regressions, you should be able to make 3 conclusions, which are: (a) which predictor variables actually predict the outcome, (b) for those predictor variables that predict the outcome, which ones have greater impact and (c) the amount of change we can expect in outcome variable if we make changes to specific predictor variables. This is critical as you would have the greatest ROI in improving your outcomes by working on the predictors that actually influence it and with a focus on those that have greater impact. This is especially beneficial considering that usually there is limited time and resources to work on everything.
Going back to our earlier example on employee engagement, there are 4 dimensions that can contribute to it, and within each dimension there can be multiple sub-facets (e.g., culture encompasses communication, autonomy and rewards), which can make it difficult for organizations to understand which factors drive employee engagement in the most impactful way. The use of people analytics and regression analyses can provide organizations with insights on that. Having a simple and intuitive dashboard that can summarise all the output generated from the analyses conducted will go a long way for organization leaders and managers to act on the insights quickly after.
The power of making decisions based on data and analytics rests in organizations’ hands. Tools and technology are already widely available for ease of use and it is up to organizations to adopt them to their advantage. If in-house resources and capability is a challenge, consider using external platforms such as EngageRocket to accelerate your people strategies today.
How to act on results from regression analyses
Once you have identified the key predictors of engagement, or any other outcome variable, here are a few suggestions on how to leverage on the insights in an action-oriented way.
#1: Communicate, communicate, communicate
To close the feedback loop and make the entire engagement survey process a more meaningful one for employees, the results of the survey should be conveyed to the entire organization. Focus on the key predictors from the regression analyses as it reflects things that employees care most about. Managers will then also be able to know which factors to work on if they are keen to improve engagement, motivation and productivity from their team members.
#2: Deep dive into key predictors
While the regression analyses have revealed some key predictors, it may not be clear why these predictors have such a high impact on employees. For example, we may find that autonomy has a strong relationship with engagement but it may not be clear how employees want to be empowered in the workplace. Do they want more freedom in choosing where or when to work or do they want to have more decision-making power in the way they work? In such situations, a deeper dive into some of the key predictors found may be helpful. Shorter surveys that focus on peeling back the onion further will be beneficial as input when brainstorming for ways to enhance the key predictors.
#3: Prioritise initiatives based on key predictors
As briefly mentioned earlier, doubling down our focus to work on predictors that have great influence on important outcomes would allow for higher ROI. We want to make sure that we invest in time and resources on things that will move the needle. However, that is not to say that low-impact drivers should be completely ignored. Low-scoring predictors, especially those that are consistently low across time, deserve some attention as well since the possibility of a floor effect and restriction of range would mean that it would be hard to pick up any trends during statistical analysis for the specific predictors, as seen below.
#4: Celebrate and improve
Amongst the key predictors, it may be worthwhile to break them down further into high-scoring versus low-scoring predictors as well. For example, while both teamwork and innovation can be key predictors of engagement, teamwork may be a high-scoring predictor (e.g., mean score = 4.56/5 or favorable score = 65%) and innovation may be a low-scoring predictor (e.g., mean score = 2.34/5 or favorable score =14%). With that categorization, it shows that there is more room for improvement for innovation but less so for teamwork. However, that does not mean we should neglect teamwork as we should celebrate that we are doing well in that aspect.
%20(1).png?width=1201&height=450&name=CTA-Banner-Blog%20(1201%20%C3%97%20450px)%20(1).png)
About the Author

Dr Yvonne Tan is the Lead People Scientist at EngageRocket. She has 10 years of experience in organizational psychology research and people analytics across APAC, ANZ, UAE and UK. In her free time, she likes to go museum hopping and cooking.

 .
. 